Metabolic dysfunction rarely appears overnight. Long before a patient is diagnosed with prediabetes or Type 2 diabetes, subtle disruptions in cellular energy handling take root.
At the center of this progressive metabolic shift is insulin resistance.
In standard primary care, screening for metabolic disease typically relies on basic blood sugar metrics, such as fasting plasma glucose or glycated hemoglobin (HbA1c).1,2 While these tests are accessible and standardized, they often miss the earliest stages of metabolic strain.
Because the pancreas can hypersecrete insulin for years to keep circulating blood sugar within normal limits, significant insulin resistance can develop quietly while standard glucose labs look completely healthy.3,4
Here is an evidence-based breakdown of what insulin resistance is, why diagnostic thresholds can obscure early disease, the limitations of standard screening, the utility of advanced metrics like HOMA-IR and Continuous Glucose Monitoring (CGM), and how to interpret these tools rationally.
1. What Is Insulin Resistance and Why Does It Matter?
Insulin is a master anabolic hormone produced by pancreatic beta cells. Its primary role is to facilitate glucose uptake into peripheral tissues—principally skeletal muscle, liver, and adipose tissue—while suppressing hepatic glucose production and lipolysis.3,5
Insulin resistance occurs when target tissues become less responsive to insulin signals.3 To maintain normal blood glucose levels (euglycemia), the pancreas compensates by secreting higher amounts of insulin. This state—known as compensatory hyperinsulinemia—allows blood glucose to remain normal for years, but at the cost of chronically elevated circulating insulin.3,4
Pathophysiological Consequences
Chronically elevated insulin and impaired tissue signaling drive systemic vascular and metabolic damage long before frank hyperglycemia develops:3,5
Atherogenic Dyslipidemia: Insulin resistance alters lipid metabolism in the liver, increasing the synthesis of large VLDL particles, raising circulating Apolipoprotein B (ApoB) and triglycerides, and reducing HDL cholesterol.3,5
Endothelial Dysfunction & Hypertension: Hyperinsulinemia impairs vascular nitric oxide production while stimulating sympathetic nervous system activity and renal sodium retention, contributing to arterial stiffness and elevated blood pressure.3,5
Hepatic Steatosis: Impaired insulin suppression of adipose lipolysis increases free fatty acid flux to the liver, driving Metabolic Dysfunction-Associated Steatotic Liver Disease (MASLD).3
Systemic Inflammaging: Hypertrophic, insulin-resistant adipocytes secrete pro-inflammatory cytokines (such as IL-6 and TNF-alpha), promoting low-grade systemic inflammation.3,5
Cognitive and Neurological Associations: Chronic hyperinsulinemia and cerebral insulin resistance are increasingly recognized as important contributors to age-related cognitive decline and neurodegenerative risk.3
2. A Continuous Spectrum vs. Arbitrary Diagnostic Cut-offs
Metabolic health exists on a continuous physiological spectrum.1,3 On one end is high insulin sensitivity with low fasting insulin requirements; on the other end is severe insulin resistance accompanied by progressive pancreatic beta-cell exhaustion.3,4
To standardize clinical care, professional guidelines establish discrete diagnostic criteria:
Normal: Fasting Plasma Glucose < 100 mg/dL | HbA1c < 5.7% | 2-Hour OGTT < 140 mg/dL
Prediabetes: Fasting Plasma Glucose 100–125 mg/dL | HbA1c 5.7%–6.4% | 2-Hour OGTT 140–199 mg/dL
Type 2 Diabetes: Fasting Plasma Glucose >= 126 mg/dL | HbA1c >= 6.5% | 2-Hour OGTT >= 200 mg/dL
While these cut-offs are necessary for clinical categorizations and trial design, physiology does not operate like a binary switch.1,3 A patient with a fasting glucose of 98 mg/dL and an HbA1c of 5.5% is classified as "metabolically normal." However, if maintaining that glucose level requires four times the normal amount of fasting insulin, significant cellular resistance and vascular strain are already occurring.3,4
Crucially, by the time fasting glucose crosses 100 mg/dL or HbA1c reaches 5.7%, substantial beta-cell dysfunction is already established. Postmortem tissue analyses and metabolic modeling demonstrate roughly a 40% reduction in beta-cell volume and a marked loss of first-phase insulin secretion at the prediabetes threshold.4,5
3. Standard Screening Guidelines and Their Blind Spots
Current preventive guidelines—such as those from the U.S. Preventive Services Task Force (USPSTF) and the American Diabetes Association (ADA)—recommend screening for prediabetes and Type 2 diabetes in adults aged 35 to 70 who have overweight or obesity, or universally starting at age 35 regardless of risk factors.1,2
Standard screening relies primarily on fasting plasma glucose or HbA1c.1 While convenient, each test has specific blind spots regarding early detection:
Fasting Plasma Glucose
The Blind Spot: Fasting glucose is often one of the last glycemic markers to break down.3,4 Compensatory hyperinsulinemia successfully maintains normal fasting blood sugar for years despite profound peripheral insulin resistance.3,4
Glycated Hemoglobin (HbA1c)
The Blind Spot: HbA1c reflects average glycemia over 2 to 3 months.1 While it integrates postprandial glucose into a composite average, it can mask the pattern, magnitude, and glycemic variability of postprandial glucose spikes.1,4 Furthermore, HbA1c is influenced by red blood cell turnover rates, anemia, hemoglobin variants, and ethnicity, occasionally leading to false reassurances.1
Oral Glucose Tolerance Test (OGTT)
The Clinical Utility: The 2-hour 75g OGTT measures how quickly the body clears a standardized glucose load, making it sensitive for detecting early impaired glucose tolerance.1,3
The Limitation: OGTTs are cumbersome, time-consuming, and rarely performed in routine primary care.1 More importantly, a standard OGTT measures glucose clearance, not the underlying insulin response required to clear that glucose.3,4
4. Earlier Screening Options: HOMA-IR and CGMs
To detect metabolic strain before blood sugar rises, clinicians and researchers look beyond standard glucose panels to evaluate insulin secretion and real-time glucose dynamics.4,6
Option A: Fasting Insulin and HOMA-IR
Measuring fasting plasma insulin directly reveals the metabolic effort required to maintain baseline blood sugar.4 Combining fasting insulin with fasting glucose yields the Homeostatic Model Assessment of Insulin Resistance (HOMA-IR):4
HOMA-IR = (Fasting Insulin in uIU/mL x Fasting Glucose in mg/dL) / 405
Clinical Utility: HOMA-IR provides a validated surrogate estimate of hepatic insulin resistance, correlating strongly with euglycemic hyperinsulinemic clamp studies.4 It can identify hyperinsulinemia in patients whose fasting glucose and HbA1c are completely within standard reference ranges.3,4
Option B: Continuous Glucose Monitoring (CGM)
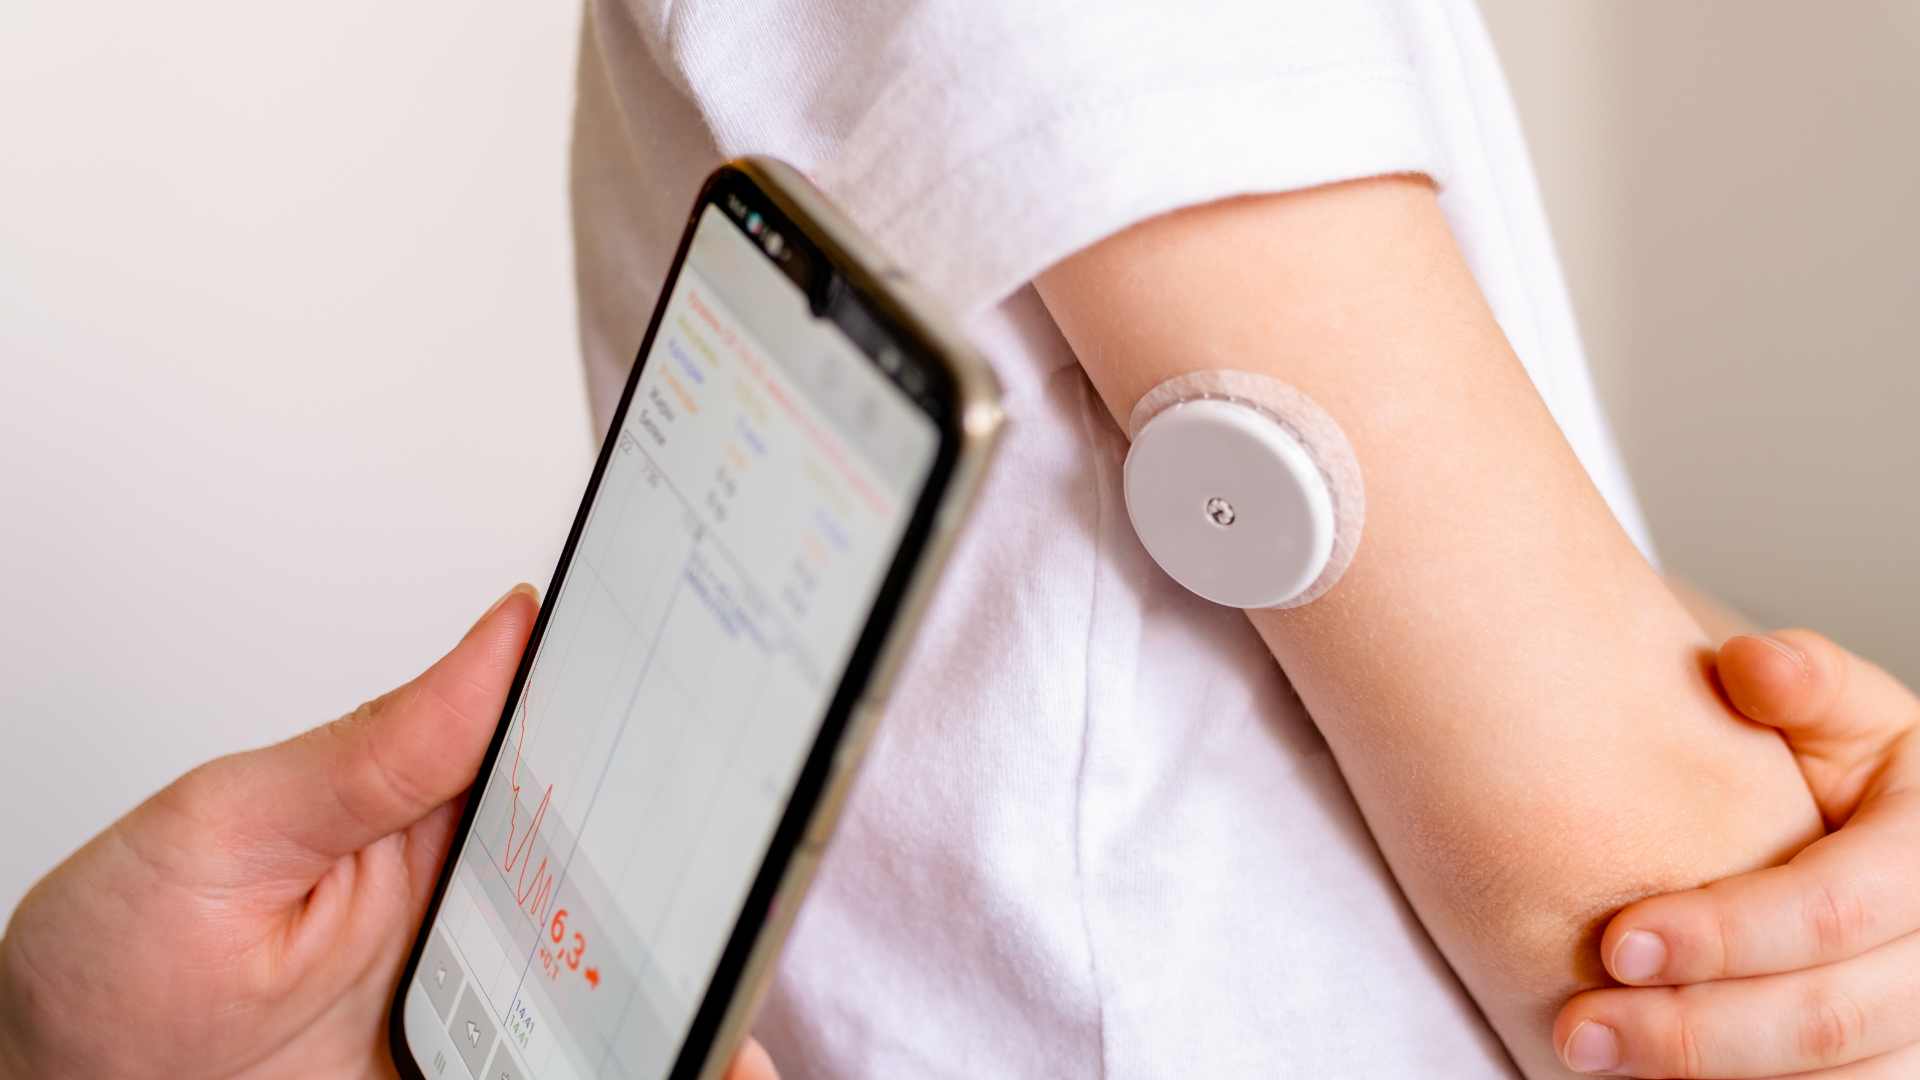
A CGM measures glucose levels in interstitial fluid every few minutes, providing real-time data on daily glycemic dynamics.6
Clinical Utility: CGMs reveal patterns that static blood draws miss: postprandial glucose excursions, glycemic variability (the magnitude of glucose fluctuations), nocturnal glucose trends, and time-in-range.6 They allow patients and clinicians to observe how specific meals, physical activity, sleep deprivation, and stress impact real-time glucose clearance.6
5. Limitations and Nuances of Advanced Screening
While HOMA-IR and CGMs offer deeper physiological insights, neither tool is a flawless diagnostic solution. Clinicians and patients should recognize their distinct limitations:4,6
Issues with Fasting Insulin & HOMA-IR:
Lack of Assay Standardization: Unlike glucose or HbA1c, clinical laboratories use differing automated immunoassay platforms to measure insulin, making universal reference cut-offs difficult to establish.4
Pulsatile Secretion: Pancreatic insulin is secreted in pulsatile bursts.3,4 A single fasting blood draw represents a static snapshot that can fluctuate depending on acute stress, recent exercise, or sleep quality.4
Variable Cut-Offs: Clinical thresholds for "resistance" in the literature vary widely (commonly ranging from > 1.4 to > 2.5) depending on the population, age, sex, and assay used.4
Issues with CGMs in Non-Diabetic Populations:
Physiological Lag & Sensor Precision: CGMs measure interstitial fluid glucose, which lags behind capillary blood glucose by 5 to 15 minutes.6
Pathologizing Normal Physiology: Transient glucose elevations after a high-carbohydrate meal or during high-intensity exercise are normal physiological responses.6 Healthy non-diabetic adults typically spend ~96% of their time between 70 and 140 mg/dL, with transient spikes occurring routinely.6 Over-interpreting minor spikes can drive unnecessary food anxiety.6
Lack of Long-Term Outcome Data: Long-term continuous use of CGMs in healthy, non-diabetic populations lacks outcome data proving superior disease reduction compared to routine metabolic care.1,6
6. A Practical, Evidence-Based Strategy
Detecting insulin resistance early does not require expensive devices or unvalidated protocols. Clinicians can build a complete picture of metabolic health by combining routine laboratory markers, physical examination, and targeted testing:1,3,5
1. Evaluate Routine Laboratory Surrogates
Standard bloodwork contains strong signals of underlying insulin resistance:3,5
Triglyceride-to-HDL Ratio: Elevated TG/HDL ratios correlate strongly with insulin resistance.3,5 However, thresholds are sex- and population-specific—typically defined as > 3.5 in men and > 2.5 in women among European-ancestry cohorts, with lower thresholds in Asian cohorts and weaker associations in Black individuals.5
Apolipoprotein B (ApoB): Elevated ApoB reflects an increased number of atherogenic particles, frequently driven by hepatic insulin resistance.5
Liver Enzymes (ALT/AST): Unexplained elevations in ALT, even within the upper "normal" range, can signal early hepatic fat accumulation.3
2. Assess Physical Clinical Markers
Physical measurements remain powerful predictors of metabolic strain:1,3
Waist-to-Height Ratio: Maintaining a waist circumference less than half your height (< 0.5) serves as a reliable proxy for visceral adiposity.3
Blood Pressure: Persistent resting blood pressure >= 120/80 mmHg often reflects early vascular changes associated with hyperinsulinemia.3,5
3. Consider Targeted Fasting Insulin / HOMA-IR
If routine surrogates suggest risk despite normal fasting glucose, a fasting insulin level drawn alongside glucose can calculate HOMA-IR.4 Interpreting fasting insulin in context—aiming for optimal sensitivity rather than merely staying below broad laboratory thresholds—helps clarify early risk.4
4. Use CGMs Selectively, Not Indefinitely
For individuals seeking actionable feedback on meal composition, sleep, and physical activity, using a CGM for 2 to 4 weeks can provide valuable insights into personal glucose tolerance.6 Once patterns are identified and lifestyle habits are adjusted, continuous monitoring is rarely necessary for non-diabetic individuals.6
The Bottom Line
Insulin resistance is an early, reversible driver of cardiovascular and metabolic disease.3,5 Relying solely on fasting glucose or HbA1c to monitor metabolic health means waiting for pancreatic compensation to fail before taking action.3,4
By understanding the continuous spectrum of metabolic disease, tracking surrogate lipid and physical markers, and selectively utilizing tools like HOMA-IR or short-term CGM monitoring, you can intercept metabolic decline years before it manifests as overt disease.1,3,4
References
American Diabetes Association Professional Practice Committee. 2. Diagnosis and Classification of Diabetes: Standards of Care in Diabetes—2026. Diabetes Care. 2026;49(Suppl 1):S20-S42.
US Preventive Services Task Force. Screening for Prediabetes and Type 2 Diabetes: US Preventive Services Task Force Recommendation Statement. JAMA. 2021;326(8):736-743.
DeFronzo RA. From the Triumvirate to the Ominous Octet: A New Paradigm for the Treatment of Type 2 Diabetes Mellitus. Diabetes. 2009;58(4):773-795.
Matthews DR, Hosker JP, Rudenski AS, et al. Homeostasis model assessment: insulin resistance and beta-cell function from fasting plasma glucose and insulin concentrations in man. Diabetologia. 1985;28(7):412-419.
Reaven GM. Banting lecture 1988. Role of insulin resistance in human disease. Diabetes. 1988;37(12):1595-1607.
Holzer R, Bloch W, Brinkmann C. Continuous Glucose Monitoring in Healthy Adults—Possible Applications in Health Care, Wellness, and Sports. Sensors. 2022;22(5):2030.
Clinical Oversight & Authorship
Physician revieweddelaeMD Clinical Team
Clinical content at delaeMD is written and reviewed by licensed physicians, grounded in peer-reviewed evidence and current clinical guidelines, and intended for education — not as a substitute for individualized medical advice. Reviews are non-sponsored, physician-directed, and conducted independently of industry funding.